
If you’re a single user, or an agency managing many clients, reporting is a crucial component to ongoing success. If you’re constructing reports manually, the process of investigating the data, pulling it out as screenshots (or making your own data visuals), and compiling it into a neat and tidy report can be incredibly time-consuming.
Luckily we’re here to help you speed up that process significantly.
So strap yourself in and get ready to change into the fast lane as we walk you through customising reports, reporting groups, and global reporting templates.
To navigate to the reports screen, simply click on the 'reports' tab in the menu.
 In the clients report window, next to the client that you want to create a report for, click the drop down arrow

and select 'add a report'

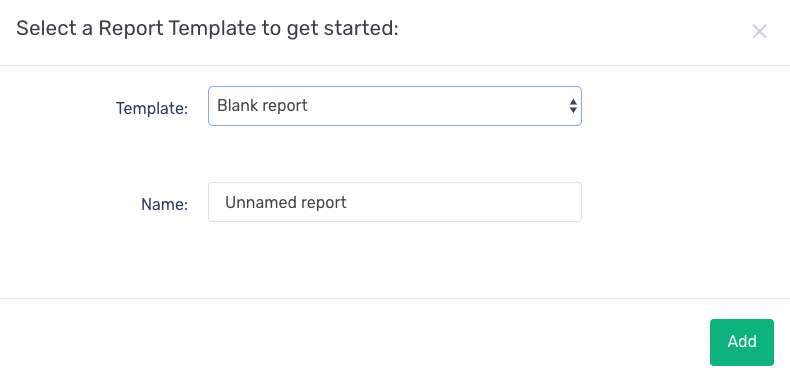
A ‘configure report for client’ window will appear, from the drop down select ‘blank report’.
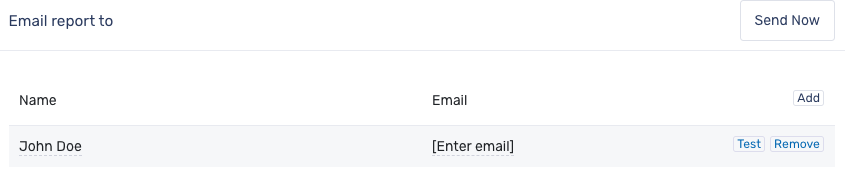
On the next screen, you will see a 'email report to' window - this is where you can define who receives the report.
To add an email, click the 'add button'. You'll then be able to edit the name and email field.
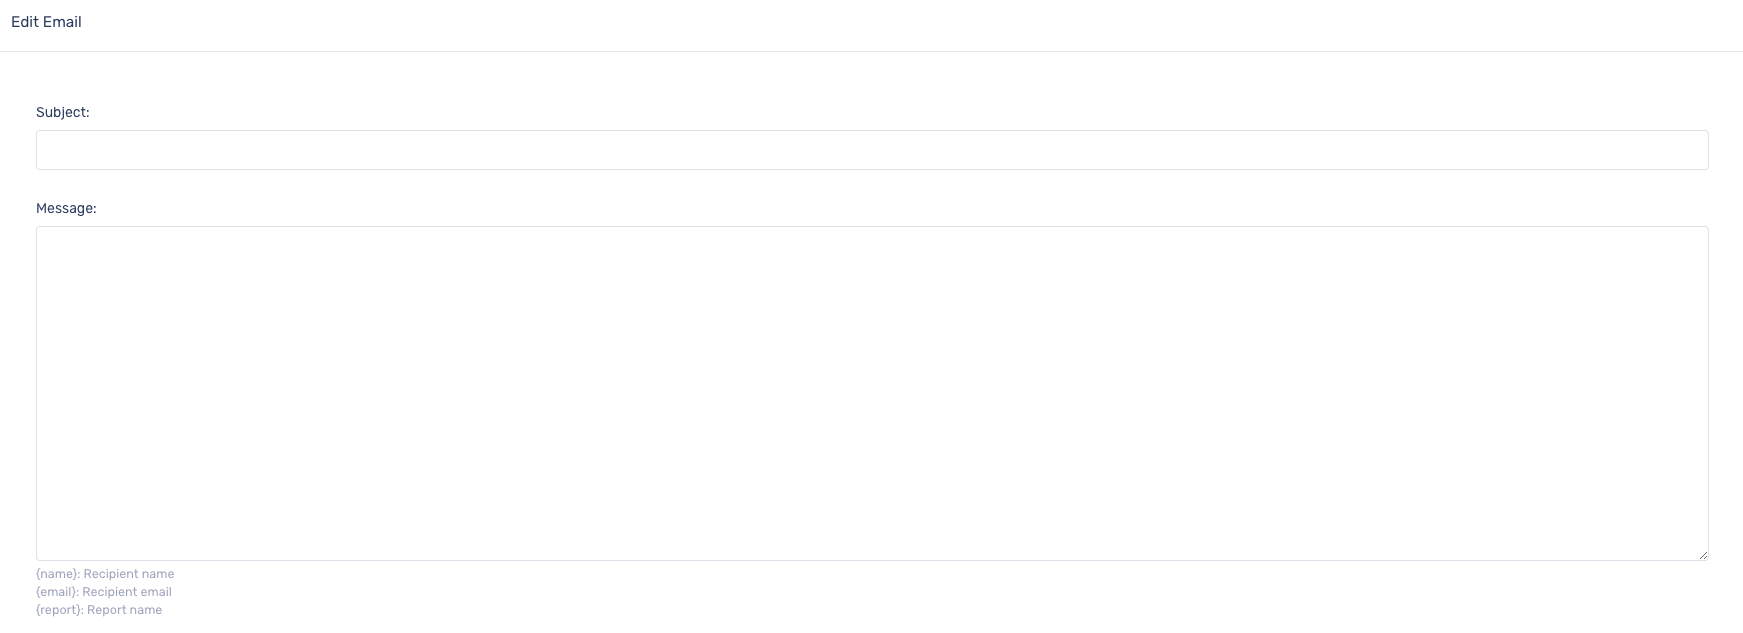
Scrolling down further, you'll find the ability to define the subject of the email and a message to go with it:
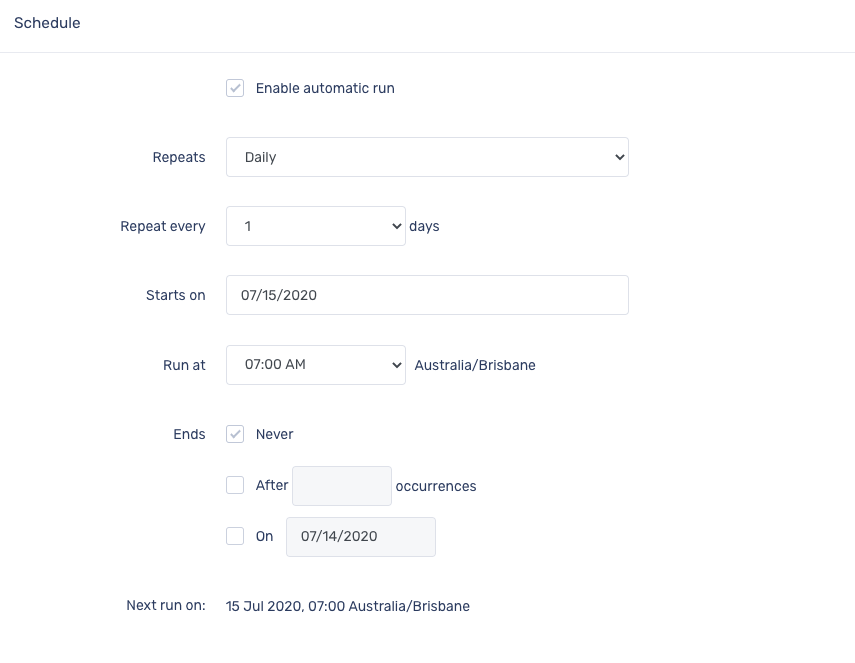
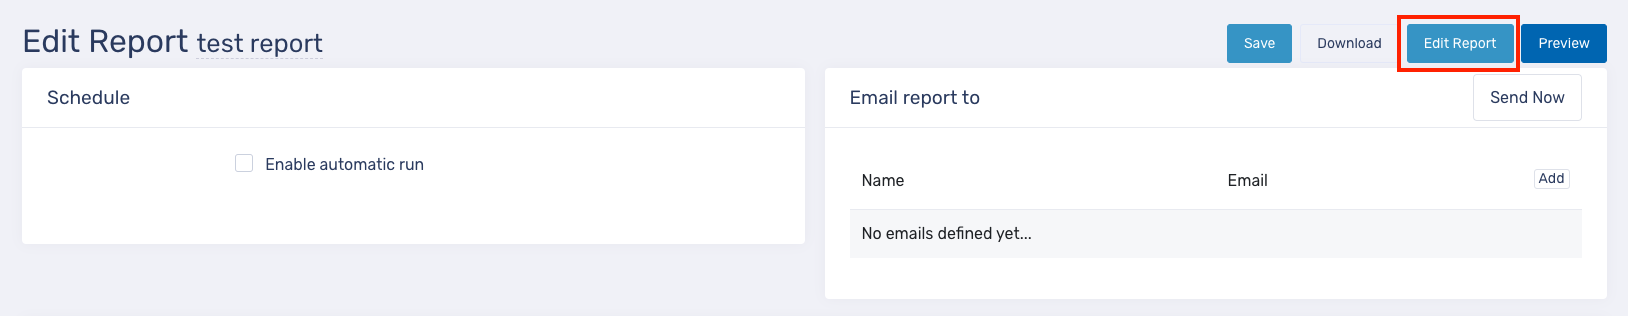
To schedule your report, click on 'enable automatic run' (scheduling information is on the same screen where you've set up your email addresses), and customise the scheduling to suit your needs:
When you’re ready to start building your report, click the ‘edit report’ button (on the same screen as where you've just set up your email addresses), and choose ‘ok’ when it asks if you want to customise.
You can now start building out your report by dragging, dropping and editing widgets
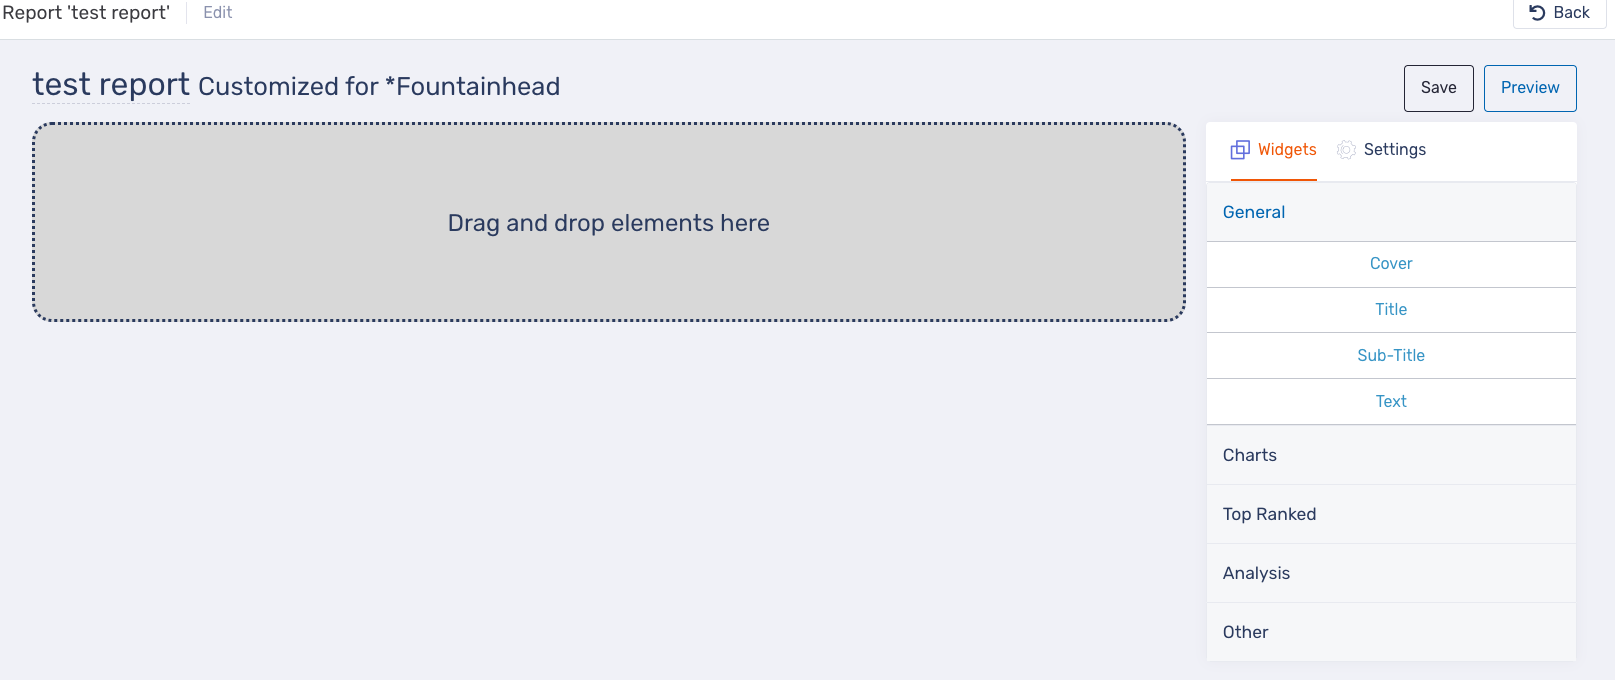
Note - after you’ve made a set of changes, be sure to hit ‘save’.
Out of the box, you’ll have a time period selector that you can modify to create different reporting periods. Simply click on the settings button (next to the save button) and click 'add'.
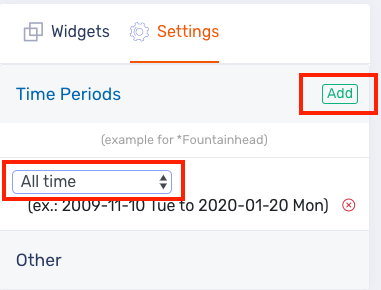
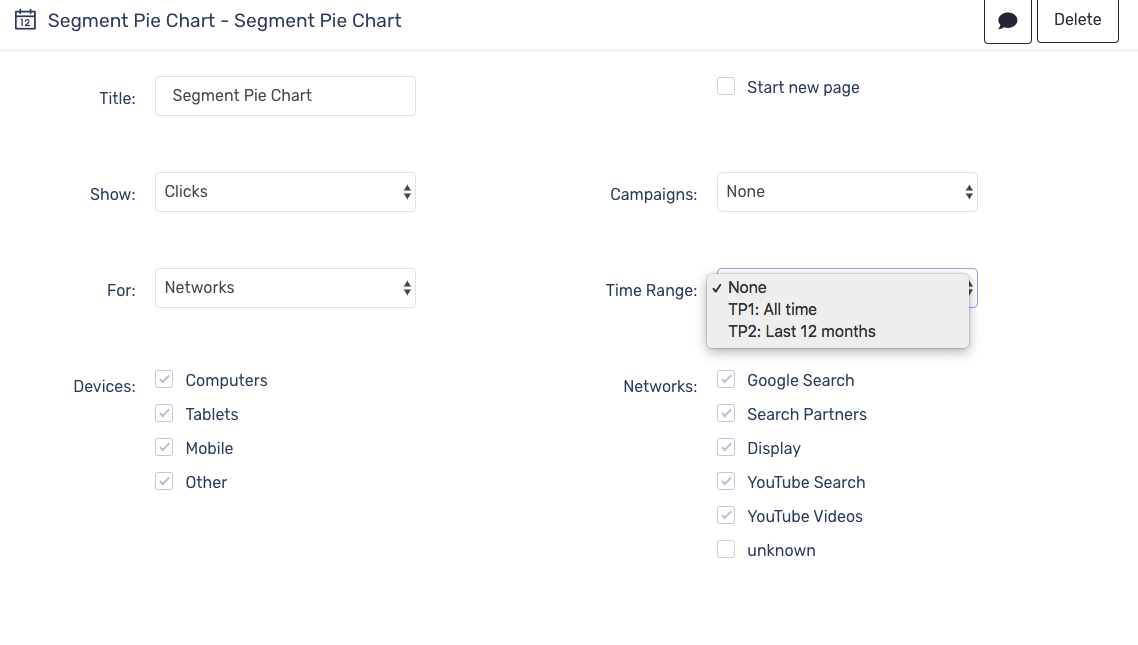
By default, the date range will be 'all time'. To change this, simply click on the time period, and a drop down will generate. Pick a time period from the list, or create a custom time period.
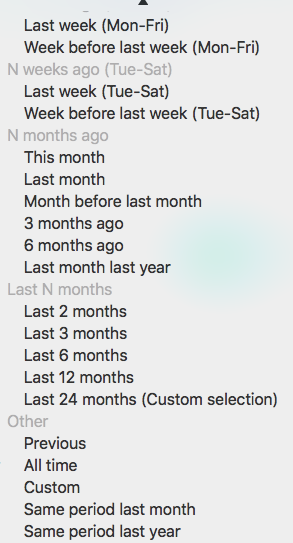
These time periods can be applied to different widgets as you build your report.
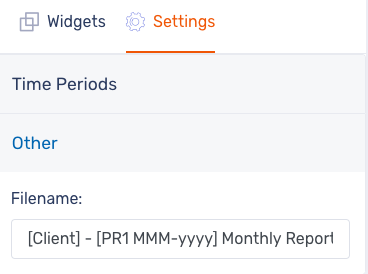
You can also edit the file name of the report under settings > other. By default, the tags within the filename will pull in the client and date settings you provide, but you can modify this as you like.
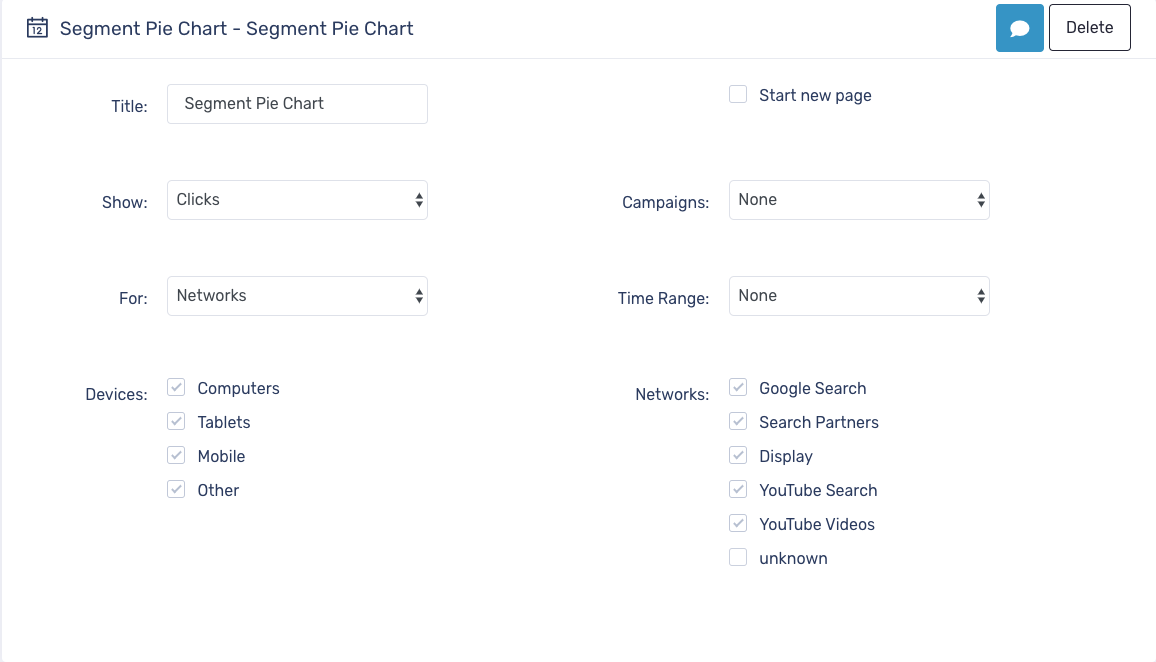
As you build out your report with he drag and drop functionality, you can expand and contract a widget by simply clicking on its headline.

When customising a widget, give it a title, and select the metrics that you want to display by selecting the relevant check boxes. Note - metrics will vary depending on the widget.
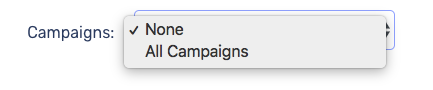
Choose the campaigns you want displayed in the widget. Note - if you haven't set up campaign reporting groups, your options will be to display all campaigns, or no campaigns.
Continue building out your report by clicking and dragging the next widget you’d like in your report. Go through the data options and customise it to the information you wish to display.
When you’re happy, hit ‘save’ next to ‘report elements (drag and drop)’. You can then preview your report by clicking ‘preview’ in the top right corner of the report builder window.